Project metrics shed light on a project’s progress, efficiency, and overall success and help project managers:
- Understand project health and performance
- Communicate project performance effectively
- Identify the root causes of project issues
This article introduces you to 10 key project metrics and shows you how to track them.
We will discuss key metrics related to time, cost, quality, and productivity, and by the end, you’ll know how to apply these insights to improve your project management approach.
What are project management metrics?
Project management metrics are indicators used to assess project performance.
They focus on everything from productivity and success rates to cost variance, return on investment, timeliness, budget, and conversions.
Project management metrics help project managers track progress, evaluate performance, and identify risks. They also improve strategic decision-making and overall project outcomes.
Why are project metrics important?
Let’s look at some of the key reasons why project metrics are important:
- Metrics can identify if projects are within budget and schedule so they meet goals.
- Important metrics like cost and schedule performance indexes help pinpoint problems early. Teams can then address issues before they escalate.
- Project managers can use metrics to make decisions that improve project health and stakeholder satisfaction.
- Metrics promote accountability by clarifying how each team member’s work impacts project success.
- Managers can allocate resources more efficiently and use available time, budget, and people.
How are project metrics different from project KPIs?
Project metrics and key performance indicators (KPIs) are essential in project management but serve different purposes.
- KPIs are highly specific strategic performance metrics tied directly to business goals. These forward-looking indicators help project managers measure project progress, efficiency, and performance.
- Project metrics are overall measurements that provide data on various aspects of a project, like completed tasks of billable time. These metrics give detailed insights into project performance but don’t get too granular about strategic objectives.
Here’s how using metrics and KPIs would be useful in a real-life project.
Let’s say a software development consultancy created and launched a new app for a client. A useful project metric to track could be the number of code commits per day, as it measures daily work.
The project KPIs could include development sprint completion rates, which measure how efficient development cycles are. Other KPIs to track here could be system uptime, which measures the operational availability of the app post-launch.
10 project metrics to know
Here’s our list of ten important project metrics:
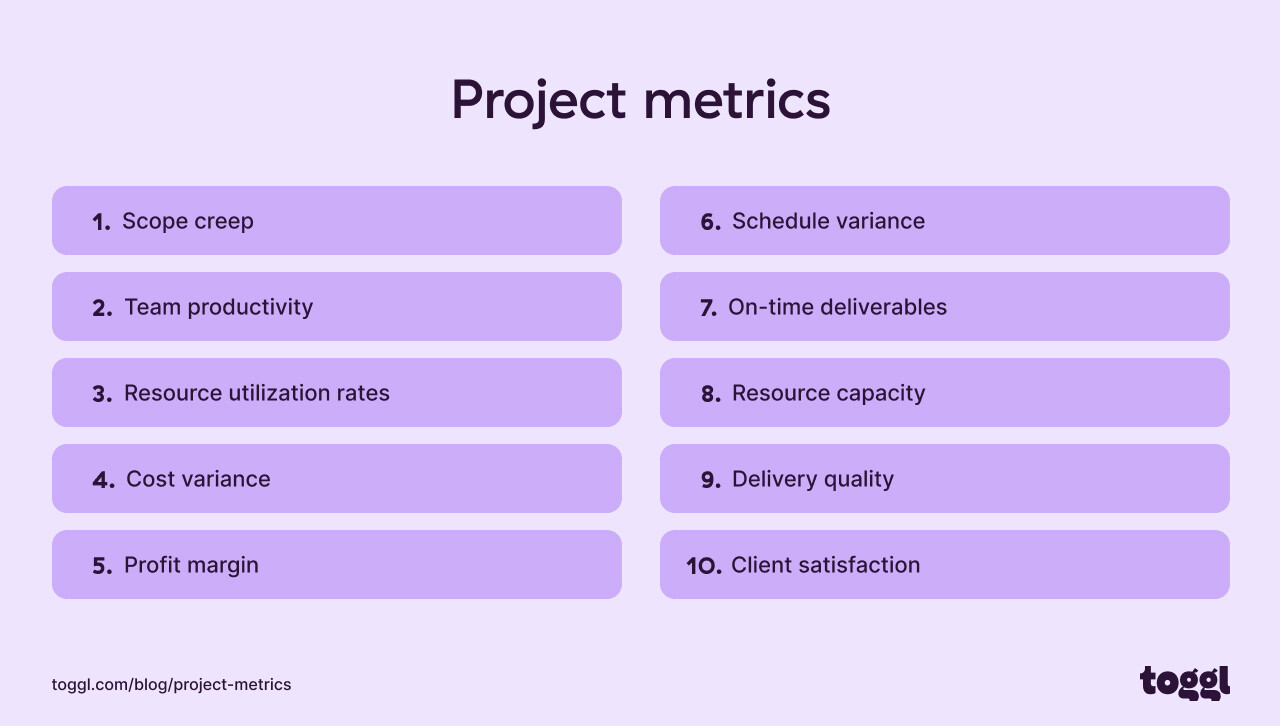
Let’s discuss each one in detail.
1. Scope creep
Scope creep happens when a project’s task list grows beyond what was originally agreed upon.
It’s important to control scope creep to keep projects within budget, meet deadlines, and achieve original goals. Managing scope creep keeps the project focused and prevents unplanned work.
You can measure scope creep using the following formula:

Let’s say a project planned to deliver 10 features but finished with 12. The scope creep would be:
- Initial features: 10
- Final features: 12
- Increase in features: 2
- Scope creep percentage = 2/10 x 100 = 20%
2. Team productivity
Team productivity measures how efficiently a project team completes tasks and achieves goals.
High team productivity means the project is on track, meets the deadlines, and stays within budget. Monitoring productivity helps team leaders identify and solve bottlenecks that slow down the project.
You can track productivity by comparing actual work against planned outputs over a specific period. However, this may be time-consuming and not always accurate.
For example, let’s say a team has to finish ten tasks in a week, each estimated to take 40 hours to complete.
At the end of the week, the project manager evaluates the actual hours and deliverables produced.
If the team finishes all ten tasks in 35 hours, they are highly productive. If they complete only six tasks in 40 hours, it could signal potential inefficiencies or bottlenecks.
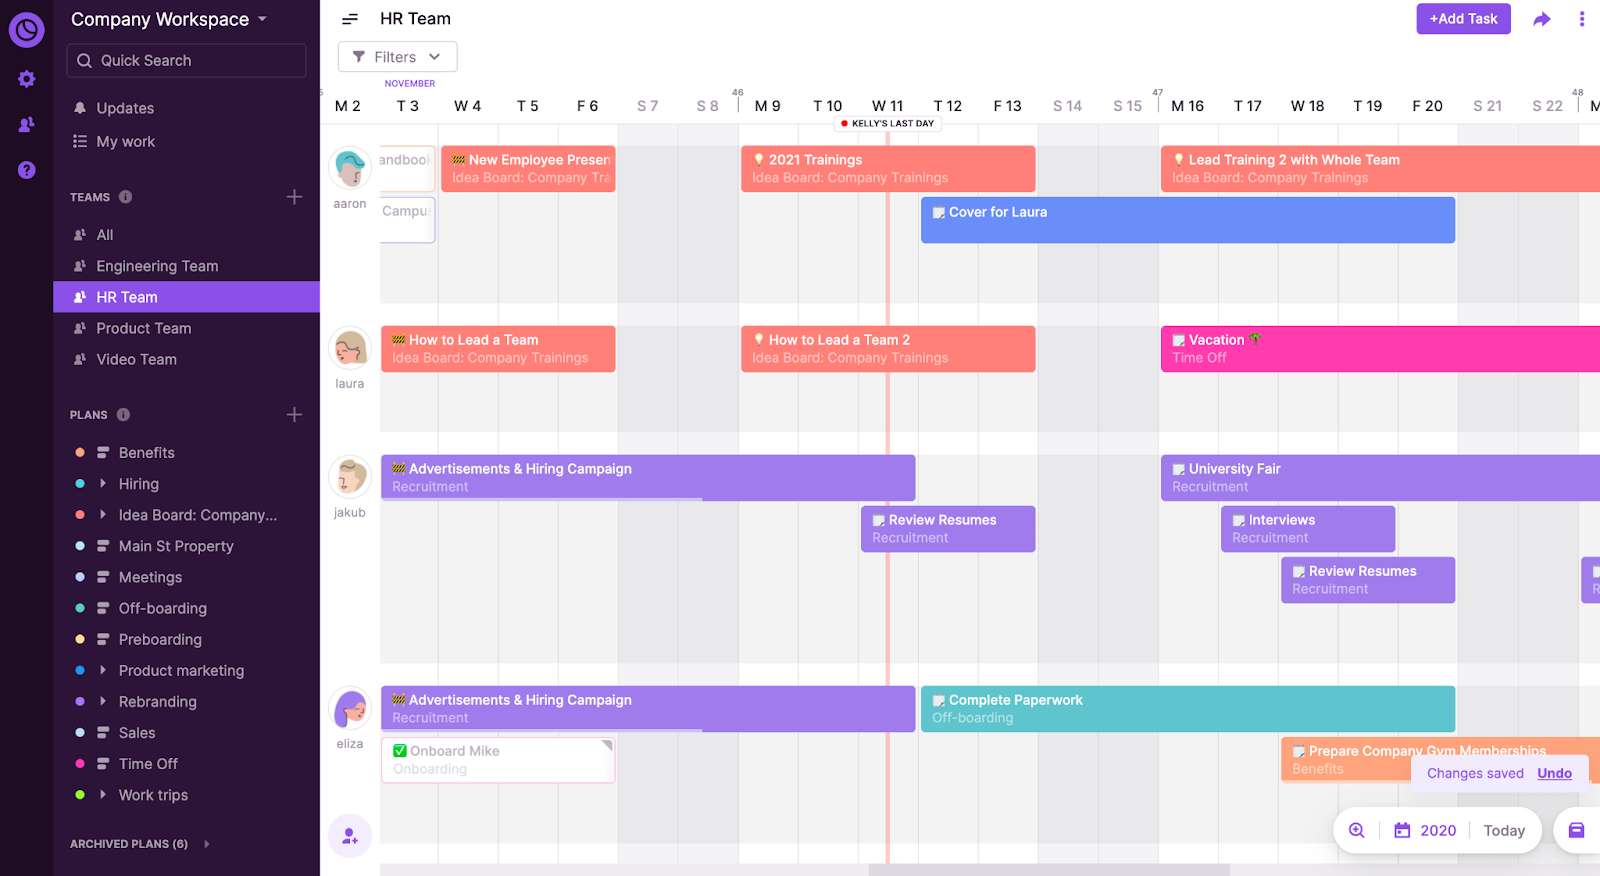
With project management software like Toggl Plan and time tracking tools like Toggl Track, tracking and measuring team productivity is much easier.
The Team Timeline feature in Toggl Plan shows each team member’s workload with completed tasks and how much time was spent on each one.
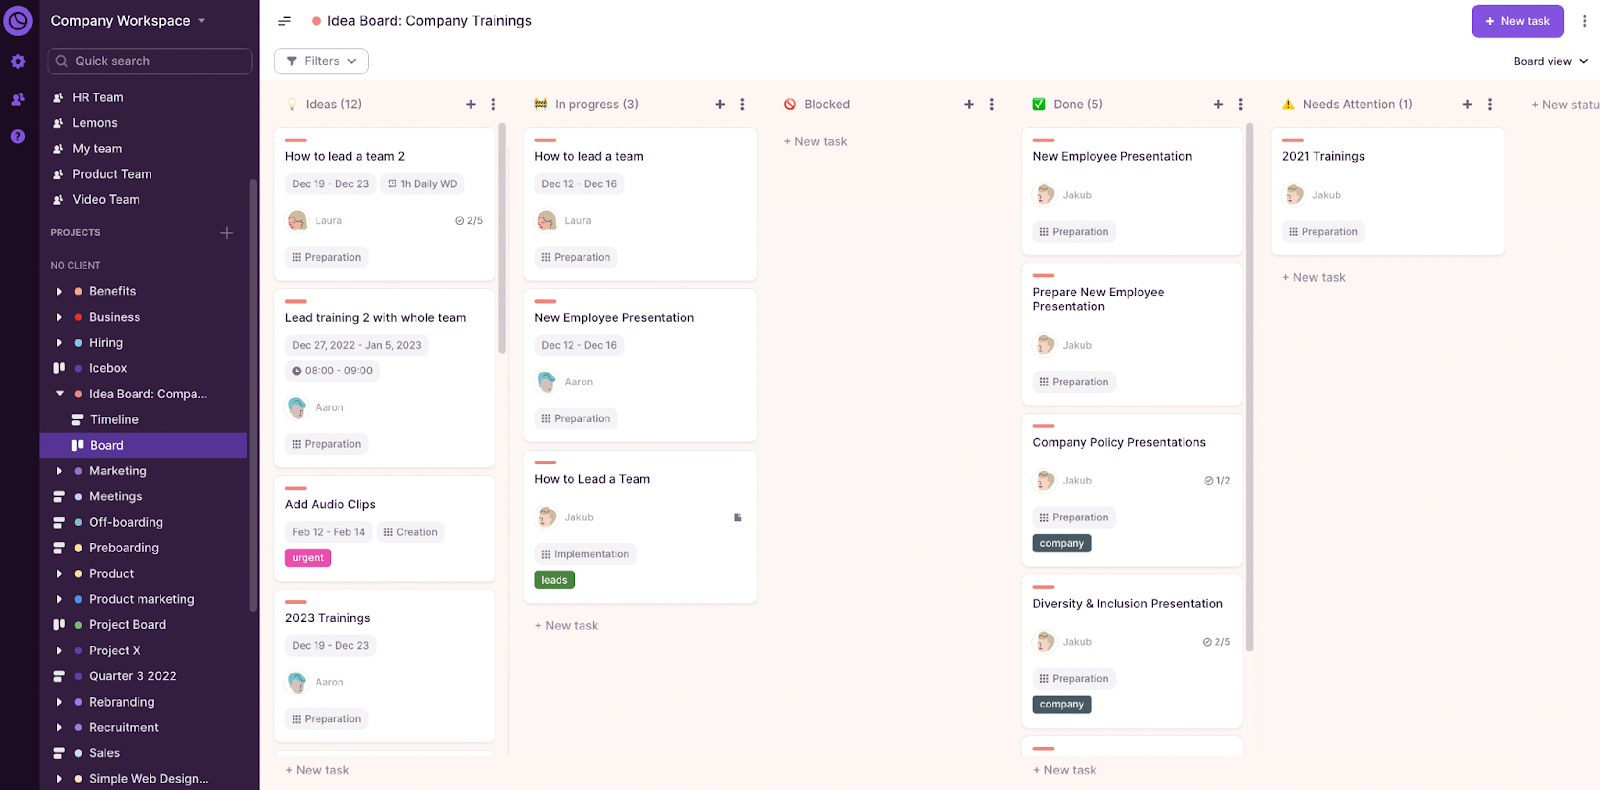
Toggl Plan also has a Project Board view, where you can get a quick view of:
- Task and project status
- Who’s responsible for completing the task
- Scheduled tasks
- Task checklists and notes
- Tags and segments
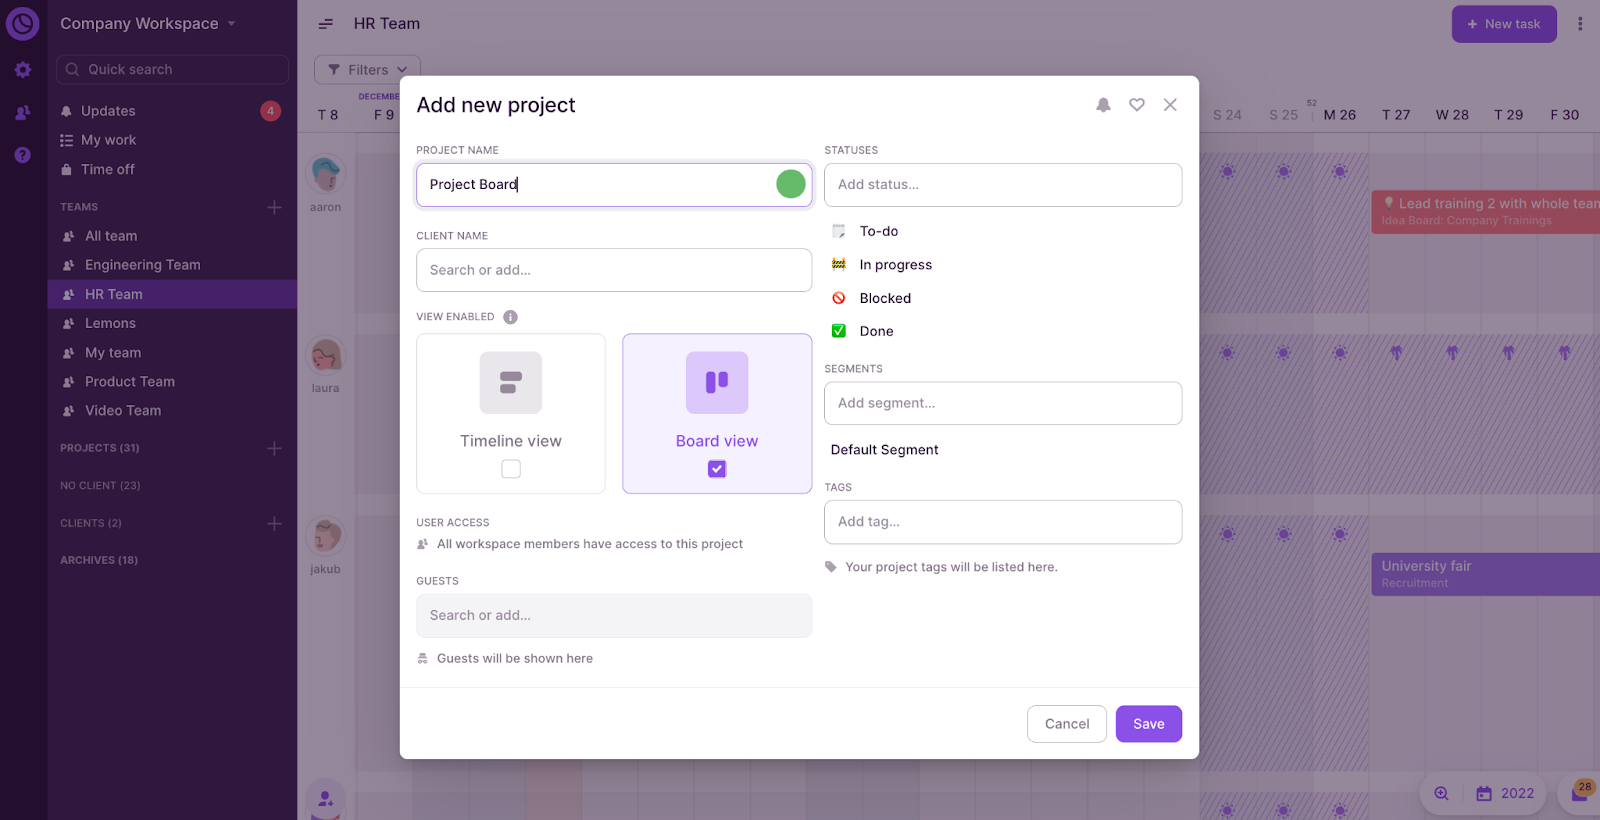
To set up a Project Board, make sure you enable it when creating your new project, as shown in the screenshot below.
You can also use the Availability Overview feature in Toggl Plan for an overview of each team member’s booked and available hours and plan work to improve their productivity.

By easily tracking and visualizing tasks and workloads with these features, you can track team productivity accurately.
![How To Improve Employee Productivity – 10 Tested Ways [2024]](images/employee-productivity-112x67.jpg)
3. Resource utilization rates
Resource utilization measures the percentage of time team members spend working compared to their available time.
This metric helps team leads identify underutilized team members and adjust tasks for more even workloads. By doing this, teams can avoid burnout and improve overall project efficiency.
The formula for calculating utilization rates for individual team members is:
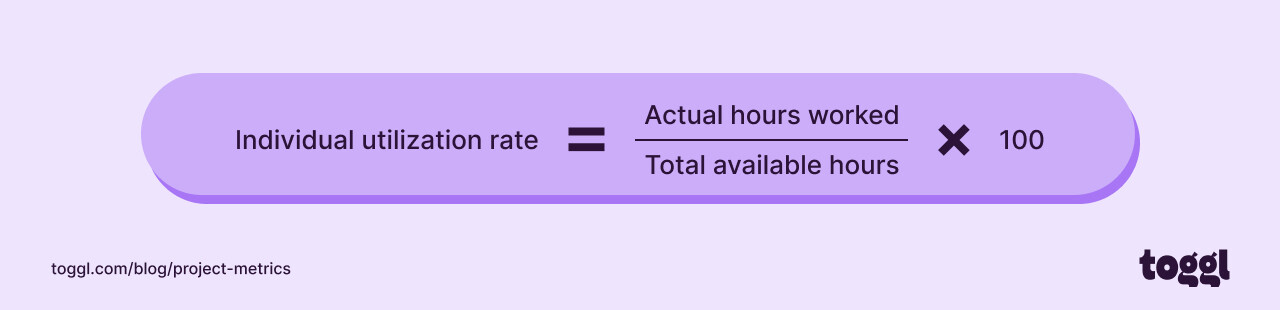
For example, if a team member is employed for 40 hours a week and works on project tasks for 32 hours, their utilization rate would be:
Individual utilization rate = 32/40 x 100 = 80%
With Toggl Plan’s Team View, you can quickly see who’s working on what.
The Availability Overview feature shows you each team member’s available hours and booking percentage.
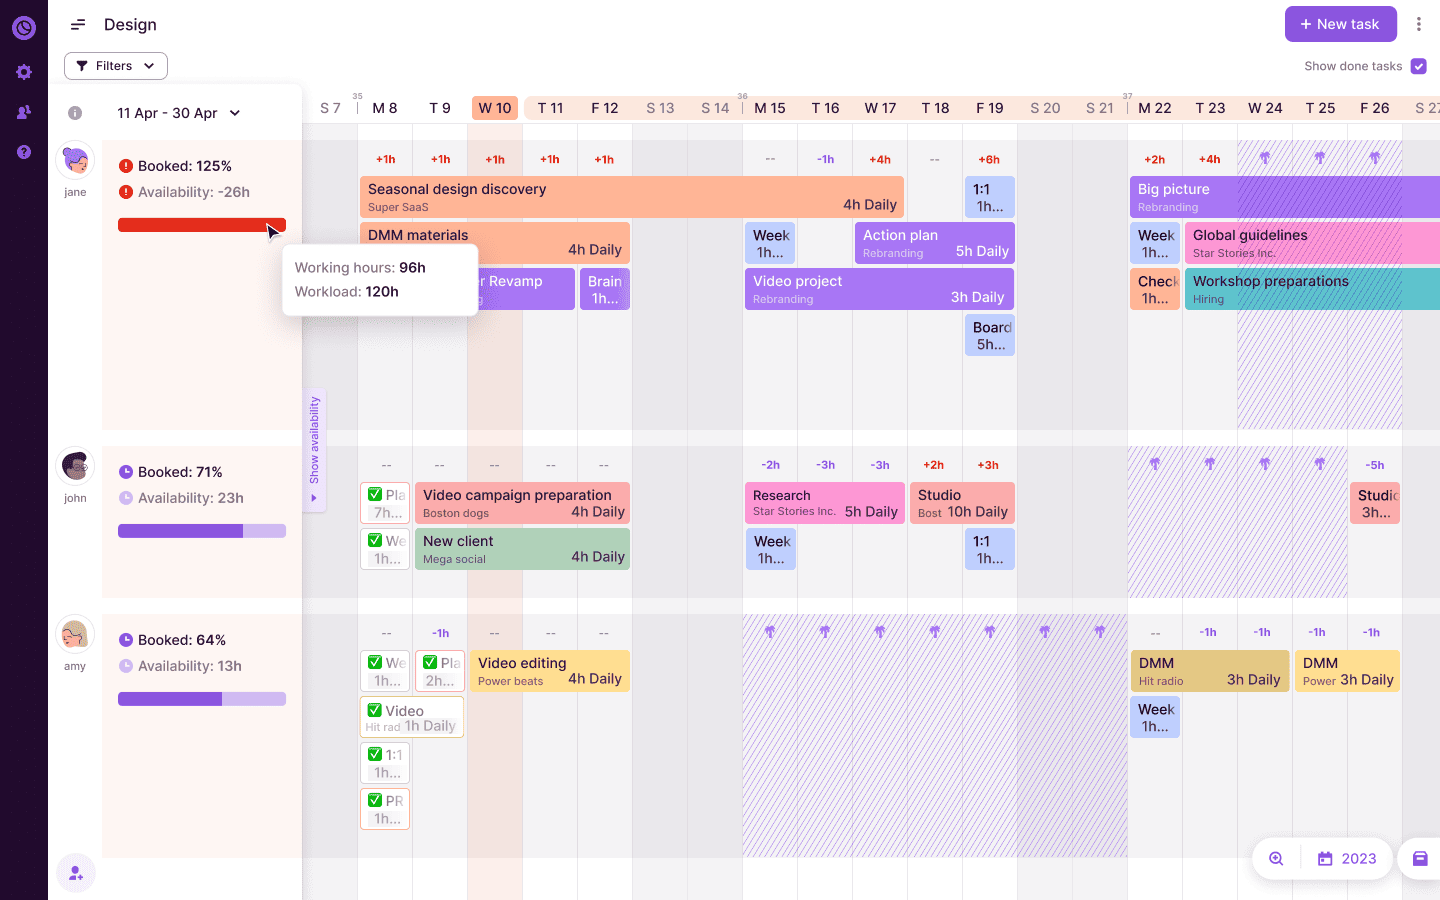
With this feature, you can view your team members’ daily, weekly, and monthly workload to plan projects accordingly. If the bar visualization and numbers are in red, it means that the person is overbooked.
The data calculated by the availability overview includes working days, without days off or weekends.
4. Cost variance
Cost variance shows if a project is over or under budget. It helps managers measure cost efficiency, identify extra budget spending, and take corrective action early.
The formula for cost variance is:
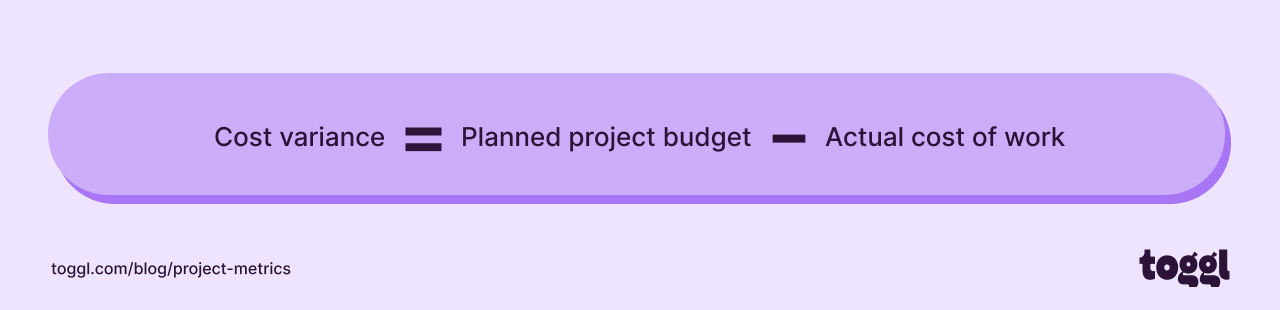
For example, if the planned budget for a project is $10,000 and the actual spending is $12,000, the cost variance would be:
Cost variance = $10,000 – $12,000 = -$2,000
This shows a negative cost variance, indicating that the project is over budget.
With Toggl Track, you can easily make accurate estimations using past project data.
Let’s see how you can quickly do analogous estimating for a project using Toggl Track features.
Firstly, create your list of similar past projects. Then, gather your historical data.
Using the Project Dashboard, you can access data from past projects, like time and costs, to help you nail your estimates.
Then, you can calculate your project’s estimate and add it to Toggl Track.
Here’s how:
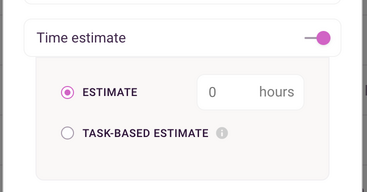
- Click on a project to edit it, or create a new project and go to Time Estimate in the popup window that appears.
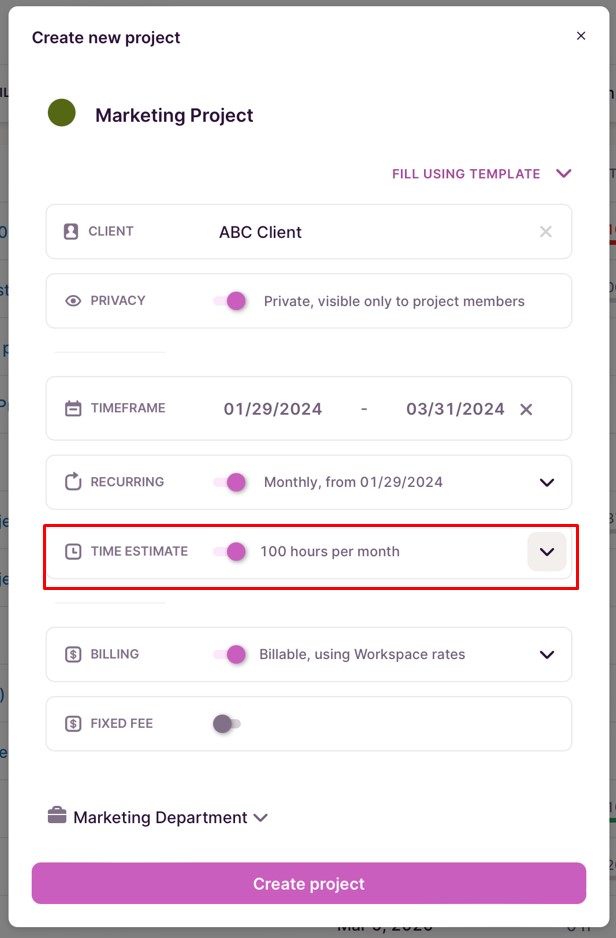
- Set your hourly time estimate. From here, you can also create task-based estimates.
After your estimates are set, access the Project Dashboard to compare actual time tracked with your estimates and easily track project costs.
Also, with our free budget estimator, you get an overview of your resources to create budget estimates in PDF format in just a few minutes.
👉Try Toggl Plan’s free forever budget estimator
![6 Key Project Estimation Techniques to Know [2023]](images/blog-header-pms-handbook_blog-header-1640x982-2-112x67.png)
5. Profit margin
Profit margin measures how much money a project makes after covering all costs.
Gross profit margin looks at the profit after direct project costs, while net profit margin considers all expenses, including overheads, labor, and taxes.
A project’s profit margin is important to measure because it shows its financial health and profitability.
Here is how to calculate a project’s gross profit margin:
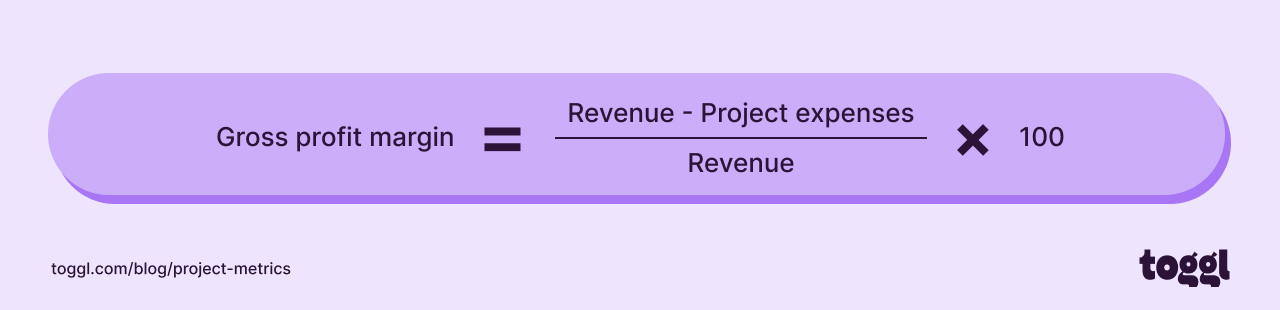
For a project with $200,000 in revenue and $150,000 in costs ($120,000 as direct costs and $30,000 as indirect costs):
- Gross profit margin = $200,000 – $120,000/ $200,000 x 100 = 40%
Now, use this formula to calculate the net profit margin:
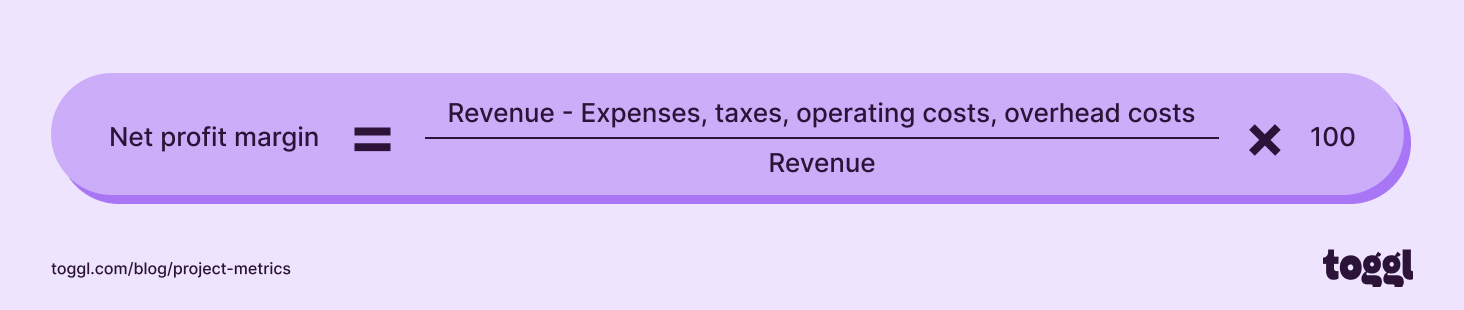
- Net profit margin = $200,000 – $150,000/ $200,000 x 100 = 25%
6. Schedule variance
Schedule variance tracks budgeted and scheduled work. It helps project managers know if they are ahead, on track, or behind the planned schedule.
This metric can be an early alarm bell for schedule delays. If it rings, a project manager can act and resolve them before they negatively impact a project.
The formula for schedule variance is:
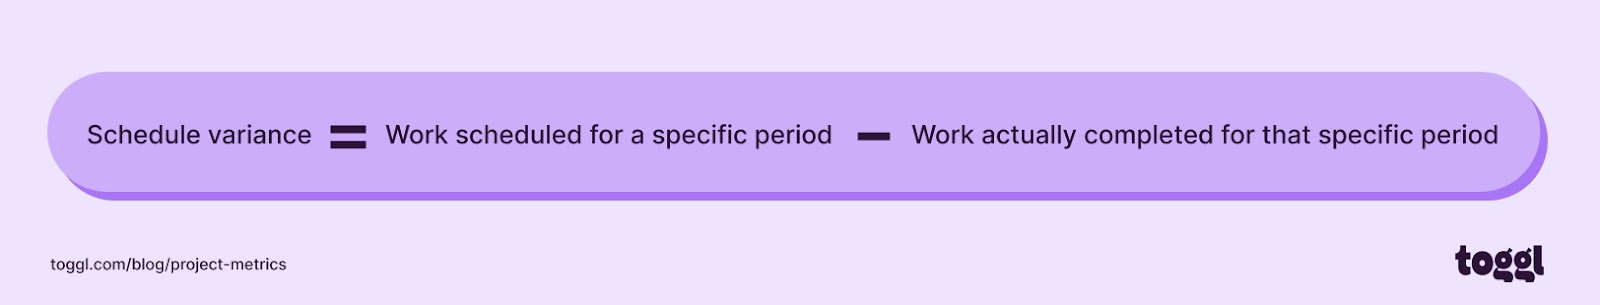
To accurately measure schedule progress, many businesses replace time-based measures with financial metrics.
The Budgeted Cost of Work Scheduled represents the planned work up to a certain date, while the Budgeted Cost of Work Performed reflects the actual work completed by that date.
Let’s imagine a project with a total budget of $200,000. It’s expected to last 10 months.
By the end of month 4, the project plan was to complete 40% of the work, equating to a Budgeted Cost of Work Scheduled (BCWS) of $80,000.
However, the project team only completed 35% of the tasks by this time, which represents a Budgeted Cost of Work Performed (BCWP) of $70,000.
Using these financial metrics, the schedule variance can be calculated as follows:
Schedule variance = BCWP−BCWS
Schedule variance = $70,000 – $80,000 = -$10,000
This shows a schedule variance of -$10,000, meaning that the project is behind schedule.
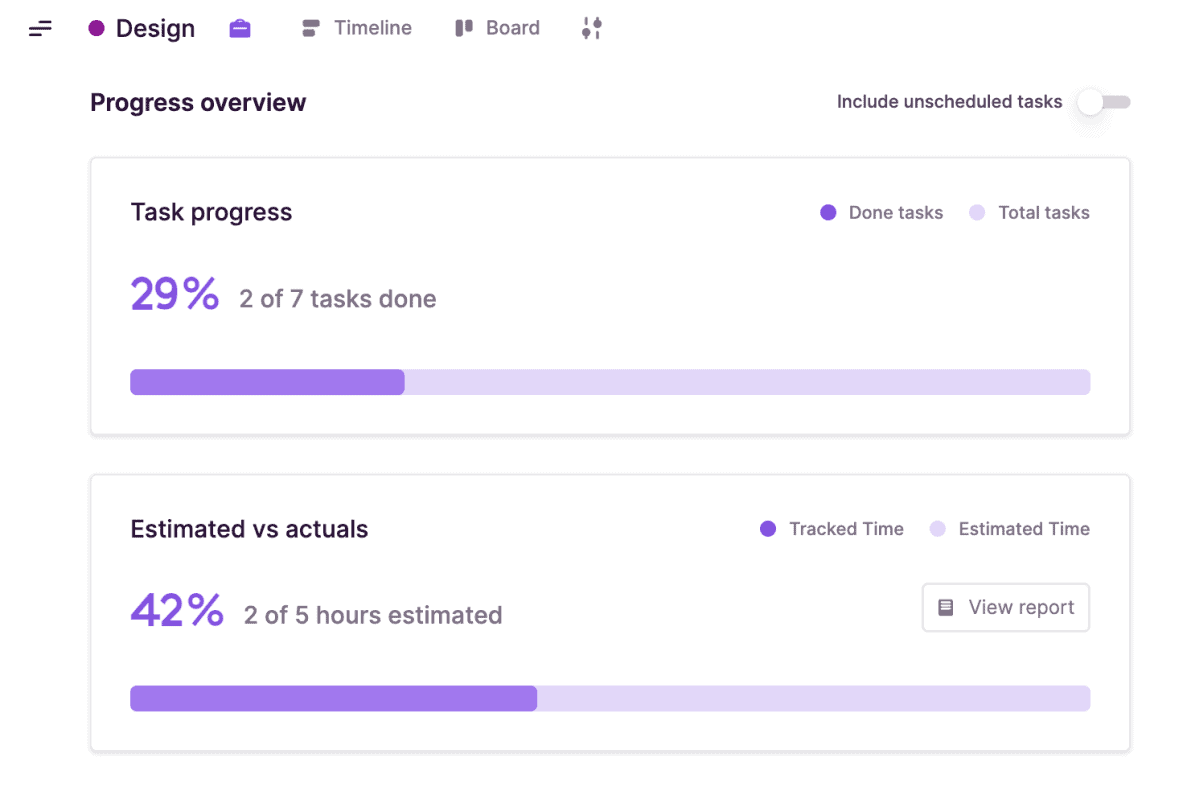
But there’s an easier way to track project schedules. Toggl Plan’s Project Progress Overview feature shows task progress and estimated vs actuals in one view.
7. On-time deliverables
On-time deliverables measure if a project is on track and if your team is meeting deadlines and fulfilling client expectations set in the scope of work.
But, if your team constantly delivers work later than planned, it signals some changes must be made. You might reduce their workload temporarily to avoid burnout or outsource some of your project work to third parties to meet client deadlines.
Toggl Plan sends daily overview emails that show a clear picture of your daily work, including:
- Daily milestones
- Daily tasks planned
- Overdue tasks from the past 14 days
- Unschedule tasks that are assigned to you
You can customize these notifications with the time of day you want to receive them to ensure you don’t miss them.
8. Resource capacity
Resource capacity is the amount of work teams and individuals can handle within a given time frame.
Here are some tips for managing demand and resource availability effectively:
- Audit your capacity regularly to spot who has too much or too little work
- Use historical data and predictive analytics to forecast future demand realistically
- Create a flexible resource pool that you can quickly reallocate as demand shifts
- Plan systems and processes with scalability in mind so you can increase or decrease capacity based on real-time demand
Toggl Plan makes tracking resource capacity straightforward.
Its Availability Overview feature shows:
- Percentages and visualization of team member bookings
- How many available hours they have left

9. Delivery quality
Delivery quality measures how well the final deliverables meet project objectives and client expectations.
Delivery quality can be broken down into two aspects:
- Project delivery quality, which looks at the overall success of a project. This metric tracks if the project meets its objectives, stays within budget, and satisfies clients.
- Task delivery quality focuses on the quality of individual tasks. Each task contributes to the final project, so the higher the task quality is, the better it is for the overall project.
For example, an agency owner might use project management software, client surveys, or team leader feedback to track and measure delivery quality.
10. Client satisfaction
McKinsey’s 2022 State of Customer Care Survey highlights the link between customer satisfaction and improved business outcomes like loyalty and revenue growth.
Businesses that measure client satisfaction constantly have better visibility over what works and what could be improved to make clients happy.
One method to quantify this metric is through the Customer Satisfaction Index. This formula involves surveying clients on quality, timeliness, and overall satisfaction with the project.
The Customer Satisfaction Index formula is:
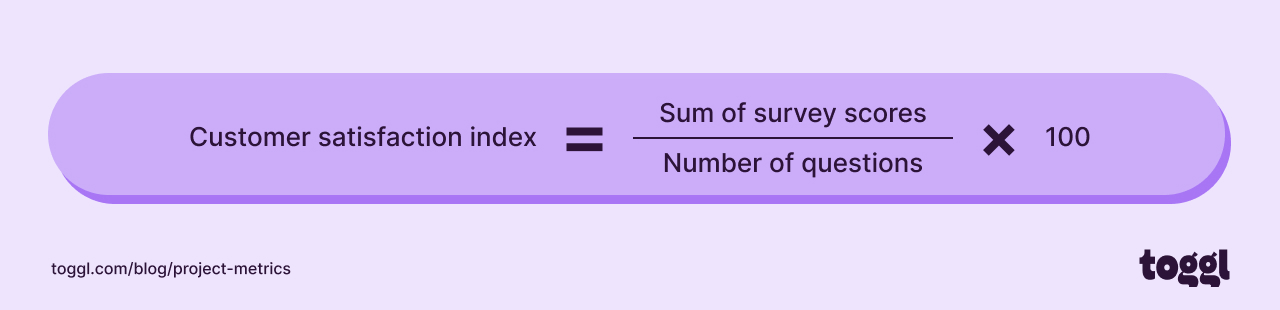
For example, if 10 clients rate their satisfaction with your project on a scale of 1 to 10, and the combined score from all clients is 85 out of 100, the Customer Satisfaction Index would be:
Customer satisfaction index = 85/(10×10) x 100 = 85%
How do you choose which project metrics to track?
Tracking every project metric on our list can be time-consuming and may not be effective.
But, choosing the right project metrics to focus on allows team leads to get specific about what must be tracked and measured.
Here’s how to choose the metrics that matter for your project:
- Project objectives: Align metrics with your project’s specific goals and objectives. Metrics that directly reflect your objectives are relevant and contribute to project success.
- Project scope and scale: The size and complexity of your project influence which metrics matter. Larger projects require more detailed and comprehensive metrics to fully capture their progress and performance.
- Stakeholder demands: Consider the needs and expectations of your stakeholders. Metrics that provide insights into how well your project meets these requirements increase transparency and trust.
What are the challenges of tracking project management metrics?
When you start using project management metrics, here are some challenges you may face:
- Determining which metrics are more relevant and valuable to your project.
- You risk focusing on metrics that don’t align with your project goals.
- Collecting accurate data to measure against your metrics may be difficult. Even with accurate data, analyzing and interpreting this information can be complex.
- Tracking and analyzing metrics takes time and resources, which can be a challenge for smaller teams or limited budgets.
- As projects evolve, metrics that used to matter may become irrelevant.
- You risk focusing too much on metrics and losing sight of the bigger picture, which can lead to a culture of chasing numbers.
Over to you
Now that you know which metrics to focus on and how to track them, you might want to try Toggl Plan for free and discover how it can help you:
- Manage tasks, projects, and budgets
- Track project progress and identify roadblocks
- Measure team performance and improve resource allocation
Sign up for a free Toggl Plan account.

Work tools to elevate your productivity – apps for incredibly simple time tracking and effective project planning.
![11 Best Resource Management Software & Tools [2023]](images/resource-management-tools-min-675x404.png)